The agility offered by PowerBI is a double-edged sword. While enormously beneficial to your analytics capability, it can be an equally enormous problem without proper data and business rules governance.
Read MoreThis Is Why You Should PowerBI
PowerBI's Quick Measure functionality makes dense data readable, and provides a great example of how PowerBI facilitates cross-role agility.
Read MoreThe Myth of the NFL's 1-2 Punch
Why do NFL teams often choose to receive first in the second half of the game? Popular theory says that scoring on the final drive of the first half, then scoring again on the opening drive of the second half significantly improves the odds of winning. But is the theory correct?
Read MoreIt's A Valid Question, Mr. Hunter!
Today's blog topic was planned to be analysis of the NFL's 1-2 Punch theory, but I'm invoking my Second Rule of BI: check your work. Stakeholder resistance to a result is directly proportionate to how strongly that result contradicts the stakeholder's expected result.* So, when the outcome is dramatically different from "common knowledge," it pays to spend some time double-checking. Not to mention prepping a presentation, because you're going to have to go in-depth to reassure your audience.
So, I'm going to postpone the results of the 1-2 Punch analysis and post an article I started last fall, before life was derailed for a few months. This'll give me some time** to explore the NFL analysis more in-depth, so I don't present something that truly is flawed.
Alan Hunter is one of my favorite people to listen to, whether it's on SiriusXM or Twitter. In case you're not familiar, Hunter was one of the original MTV VJs, and is now a host on two of my favorite Sirius channels, 80's on 8 and Classic Rewind. He's a prolific Twitterer or Tweeter or whatever the hell we call it, and seems to be a genuinely nice guy, and the world could use a few more of those.
He's also very responsive to his fans on Twitter.*** Last fall, when I was giving some serious consideration to buying a ticket for the 2018 80's on 8 Cruise, I tweeted a question: would Fee Waybill be on the cruise? I think Mr. Hunter's response was giving me a small dose of good-natured sarcasm. (Like I said, genuinely nice guy.)
Still, it elicited some good-natured indignation from me. I know Fee Waybill is the lead singer for The Tubes.**** It's still a valid question. This is 2018, after all. If you buy tickets for an "80's band" concert, you'd better check the lineup closely.

Case in point: a few years ago I saw Yes at WinStar Casino...and walked out thoroughly disappointed. The performance was excellent -- but they played almost none of my favorite songs. No "Leave It." No "It Can Happen." No "Love Will Find a Way." Why? Because there are two different Yes configurations today. If you're seeing Geoff Downes, Steve Howe, and Jon Davison, you're going to get a totally different set list than if you see Jon Anderson, Trevor Rabin, and Rick Wakeman.
Or how about Fleetwood Mac? I remember being really excited a few years ago to see Fleetwood Mac tickets on pre-sale (a year ahead of time) until I read that Stevie Nicks wasn't in the lineup. I'm sure it was still an awesome concert, but to me, just not the same.
The Cars, Styx, A Flock of Seagulls, Journey...fair to say, whenever you see any 80's band today, you should ask, "Who exactly IS Styx today?" Or in the case of Van Halen, "So, who's singing this month?"
That in mind, I can't wait to see Jeff Lynn's ELO in August. Yes, this is a very different lineup from ELO Part II. (But at least in this case each version of the group performs the original ELO catalog, as far as I know. If I don't hear Jeff Lynn singing "Can't Get It Out Of My Head," I want my money back.)
Mr. Hunter, maybe I'll run into you at the United Center for the Bon Jovi concert in April? But I won't ask you if Jon Bon Jovi is going to be there. :)
* Irony: when the analysis supports the pre-supposition, everyone's happy to say, "Looks good. It's just like we thought!" Contradict the assumptions, though, and the first argument is that either the data or the analysis is wrong. Or both.
** I don't actually have time for this. I've got job applications to fill out, a screenplay to finish writing, and an iOS development tutorial that I really want to complete. But this NFL data is so intriguing...
*** I find this particularly cool. Too many celebrities forget that without the fans...you're not really a celebrity.
**** If you didn't know this, don't be embarrassed. It just means you haven't spent enough time on music trivia with me. To impress and enlighten your other friends, just reference Waybill's excellent solo contribution to the St. Elmo's Fire soundtrack, "Saved My Life."
Business Models versus Data Models
This morning I got back to one of my high-priority questions regarding my NFL data analysis -- if statistically there's a significant advantage to scoring first, why do teams almost universally defer to the second half after winning the coin toss?
The most prevalent theory seems to be that there's a bigger advantage in a 1-2 punch: scoring at the end of the first half, then scoring again immediately after receiving the opening kick of the second half. Good news -- with my handy data set from ArmchairAnalysis.com, we can put that theory to the test.
Time to augment the dataset!* I added a number of fields, tracking which team was on offense for the opening drive, which team was the offense for the final drive of the first half, and which team was on offense for the first drive of the second half. Next, how many points were scored in the H1 final drive, and how many points were scored in the H2 opening drive. This gives me all the data I need to test the hypothesis.
But wait! I compiled these new fields for ten games, just a small set for a quick check of the data logic. Good thing, because game #3 in my dataset showed the bane of the business intelligence professional: an anomaly that seems to contradict the business model.
Specifically, in the Week 1 of the 2000 season, the Eagles somehow were on offense for the first drive of EACH half. According to the business model, this can't happen. The team that kicks off first in the first half will receive the first kickoff of the second half.**
So, what's going on here? Is my business model incorrect? Or is it a data issue?*** Fortunately, this dataset has the mother of all sports data: play by play information for all 4,523 games represented. It's a virtual ton of data. Analyst heaven.
And it provides the answer. Those crafty Eagles actually kicked and recovered an onside kick to start the game. Thus, in the dataset's [Drive] table, Philly is on offense for the first drive of the game. They still get to receive the ball first in the second half, and since Dallas did not try the same maneuver, Philly ended up on offense for both opening kicks in the game. Go figure.
Is this an error in the business model or the data model? Neither, in my opinion. The business rule is that each team must make one of the opening kicks. The data definition of a "drive" is a series of events demarked by one team's possession of the ball. The kickoff is a specific business process event, and that event does not constitute a "drive."
To prevent confusion, our documentation (our data dictionary, information model definition, white papers, etc.) should include a thorough explanation of this important point. Analysts need to understand it so they handle the scenario correctly in calculated fields. Report consumers need to understand it so they don't make misguided decisions. Remember that documentation blog that I posted last week? (It's the one you skipped.)
But wait...this isn't the only scenario where the team receiving the opening kick doesn't also own the first drive, according to the [Drive] table. In the 2010 season, Miami kicked off to Oakland, and Jacoby Ford returned it 101 yards for a touchdown. In the data model, no actual drive occurred -- only the kickoff event. The first drive of the game occurred after Oakland kicked, and Miami started an actual drive from their own 1 yard line. They did go on to win, despite taking the more common route to scoring.
All right, I've discovered something crucial about my dataset. I've explained it to my stakeholders. But...the job isn't done. Before I can move on to my question about the 1-2 Punch, I must decide how to handle these scenarios during analysis. First step -- determine how often they occur.
Turns out there are 159 instances of the same team seemingly owning both "opening" drives. That's 3.5% of my total games, not an insignificant number. If this was a professional project, I'd have a governance process defined for an official decision on how to account for the scenario in reporting. Since it's my personal project, though, I only have to agree with myself. Best stakeholder ever.
The solution: add a flag to conveniently filter these games out of the analysis when I (finally) get to that question of the 1-2 Punch. But since today's blog was hijacked by my seeming anomaly, that work will have to wait until tomorrow. Such is BI.
* Data analysts get so excited about adding calculated fields to the dataset. I think that's our version of creating the CGI fire from the dragons in Game of Thrones.
** Unless the kickoff rules in 2000 were as unclear as the current day catch rules are, that is...
*** Dear BI Analysts: you may as well assume it's a data issue, until you prove otherwise. Your stakeholders certainly will. Low customer satisfaction? Bad resource utilization? Blew through the budget in one quarter? Prove it isn't a data error, then we'll talk.****
**** Keep in mind, as irritating as that attitude can be, that should be the attitude of the BI professional. You need to be 100% confident in the data before you tell your stakeholder that the data's fine.
Scope Creep vs. the Full Story
Ready for more introduction to business intelligence, through the lens of NFL football? My blog on BI and football last week prompted some fun conversations, including a theory (which can be turned into an interesting business question) from Rob, one of my old Microsoft colleagues.
To recap, my original question was "Given a deficit of X points, how much time does an NFL team need for a reasonable chance of a comeback?" I was able to purchase a fantastic set of data from ArmchairAnalysis.com, and discovered something unexpected: from the 2000 season through Super Bowl LI, the team that scored first in any given game went on to win 65% of the time.
That surprisingly high statistic leads to other interesting questions, including a bit of a puzzle: if scoring first affords a strong edge, why does the team that wins the coin toss almost always elect to kickoff first in the first half?*
I'm not digging into that question quite yet, because Rob brought up that other interesting theory: the team that gets to 20 points first almost always wins. His question opens up a great conversation about scope creep in BI projects.
Look at every project manager's resume and you'll see "avoiding scope creep" listed as a primary skill.** BI managers live in fear of scope creep, mainly because of an associated phenomenon: people who add requirements during the execution of a project often forget that their additions contributed to the project failing to complete on time. The best defense against this, of course, is another of those great management skills, "setting proper expectations." A thorough project charter should clearly outline what's in scope and what isn't, and a major change should require stakeholder review and approval.
But an additional question can't always be dismissed as scope creep. My fifth rule of business intelligence is that each stakeholder has his or her own questions that must be strategically organized.*** Part of that organization is evaluation of the question. Does it belong in the project? If so, what's the priority, and how are resources impacted?
Since my NFL analysis hobby is blissfully free of stakeholders, I decided to take a diversion from my own questions and answer Rob's.****
First, I should mention that some time ago I migrated the original data (imported from .csv files to Access) to SQL Azure. When I started adding measures and dimensions to the data, I realized I'd much rather do it in SQL than VBA. Also, it gave me a chance to try out SQL Azure as a consumer. (And some day I'll post my critique of the migration process from Access to Azure.)
The question required some additional fields in the dataset. (DrUsual's Fourth Rule of Business Intelligence: the platform must evolve. This can apply to the data itself, the hosting environment, visualization capabilities, and much more.) For each game, I added fields to flag whether either team reached 20 points, whether the team that reached 20 first went on to win the game, how many minutes remained when 20 points were reached, and what the deficit was for the trailing team, when the other team hit the 20-point mark.
Time to pivot.
First conclusion: in a game where either team scores at least 20 points, the first team to reach 20 points wins the game 86% of the time. Bravo, Rob. However, we had an inkling this was true already, since the earlier analysis indicated that any lead is relatively hard to overcome. So, let's dive a bit deeper. What other conditions cause variance in the chance to win, despite having reached 20 points first?
The most impactful key driver (that I've found) is the trailing team's deficit.
- If the trailing team is behind by 3 or less, the leading team has a 67% chance of winning.
- If the trailing team is down by 7 to 10 points, that chance of winning leaps to 81%.
- The trailing team needs two scores or more to catch up, 11-14 points, victory is 90% likely.
- Reach 20 points with at least a 15 point lead, and it's pretty much game over -- you win 95% of the time.
I was also interested in the impact of game time remaining. This should be significant, right? The more time left, the better chance of a comeback. The outcome here is interesting, though. Check out the results:
- Leading team hits 20 points with 46 to 55 minutes remaining: 90% victory.
- Leading team hits 20 points with 31 to 45 minutes remaining: 87% victory.
- Leading team hits 20 points with 16 to 30 minutes remaining: 84% victory.
- Leading team hits 20 points with 15 minutes or less remaining: 88% victory.
In addition to the tight range, there's an interesting anomaly: your best chance of winning comes when you reach 20 points with the MOST time available for the other team to come back. Two conclusions here. First, time remaining isn't as impactful as the actual deficit. Second, a team that makes it to 20 points in the first quarter of the game is probably truly outclassing the opponent. The leading team has won 52 of 58 games where this has happened.
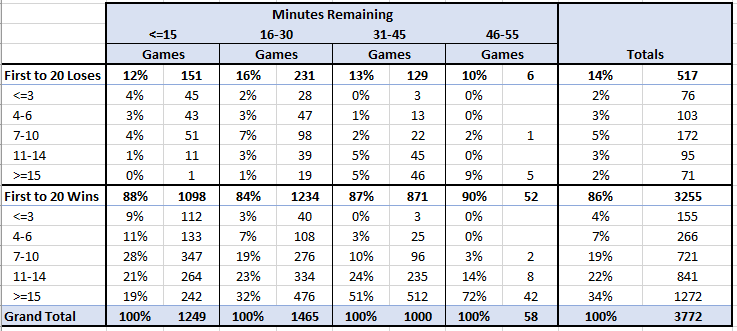
The chart above shows a pivot of both time remaining and the deficit when one team reaches 20 points. I put this one together simply for an "eyeball check" -- scanning to see if anything interesting jumps out. One clear lesson: if you're going to let the other team jump to an early lead, make it a big lead. There are six instances of a team losing after reaching 20 points in the first 15 minutes. In five of those cases, they had at least a 15 point lead when reaching 20 points. We can probably label that the "Wake Up Call Phenomenon."
(Incidentally, it was Buffalo that choked in two of these five games, giving up 21 point leads each time. In 2011 they ended up losing 49 to 21, via another phenomenon we'll simply call, "Tom Brady Was Here.")
And in case you're wondering about the single instance of a team overcoming a deficit of more than 15 points when the opposition reached 20 point mark with less than 15 minutes to go -- that was the St. Louis Rams, week 17 of 2002 versus San Francisco. The 49ers made it 20-3 with 14 minutes remaining, and the Rams managed four touchdowns in that last quarter, including a defensive TD on a fumble recovery.
Ah, sports. You make numbers so much fun.
* The most common theory is amazingly common -- that there's an even greater advantage to scoring last in the first half, then scoring on the opening drive of the second half. I'll explore that in another blog.
** I'm surprised it's not a standard skill on LinkedIn. Then again, a lot of really good skills are missing from LinkedIn's list, including "Not wasting time," "Taking accountability," and "Acting like a grownup."
*** I know, in the previous blog I gave you my first rule, and in this one I'm giving you my fifth and fourth. It's a narrative, not a recipe.
**** After all, knowledge for knowledge's sake is worthwhile, but conversations are more fun.
The First Rule of Business Intelligence
A bit of an advance apology; you're going to have to read on a bit to get to the actual rule. This is a blog, not a text book, so you don't get to read the title, skim the subheadings, and call it a day. Also, I'll get back to societal problems and the way we treat people with special needs in a few days. For now I want to post some topics that I've had in the works for a while* but haven't gotten to yet.
Super Bowls 51 and 52 were both great games, for totally different reasons.** For those who don't remember (or don't follow football***) during Super Bowl 51 the Patriots were down by 28 to 3 with only eight and a half minutes left in the third quarter. They came back to tie the game, then win in overtime.
That made me wonder: for any given deficit in a football game, how much time is needed for a team to have a reasonable shot at a comeback victory? To the Business Intelligence cave!****

First stop: ArmchairAnalysis.com. I obtained an awesome data set, play-by-play data for every NFL game (including playoff games) from the 2000 season through Super Bowl LI. And I do mean play-by-play. What happened in the play on both offense and defense, plus environmental data, and more.
Using Access and Excel, I added some measures and slicers to the main data, then set out to plot the relationship between deficits, comeback wins, and time. The primary question: given a deficit of X score, how much time is needed for the team that's behind to have at least a 50% chance of winning?
I pictured a result showing something like, "A team behind by 3 only needs 5 minutes in the game, a team behind by 10 generally needs 12 minutes, etc." However, the results quickly exemplified one of the first rules of business intelligence: your first business question is probably not the right business question.
Why the focus change? According to the pivot, 65% of teams that scored first went on to win the game. And even more significantly, if that first score is a touchdown, the win percentage jumped to a whopping 70%.
That's seriously heavy information. Of course, the first thing I did was re-check the data, make sure I hadn't made any mistakes with calculated fields. Nope. Sure looks like a team that starts with the lead has a serious advantage.
That fact changes the priority of my business question. I'm no longer concerned with the time needed to overcome a particular deficit -- I'm more concerned about the importance of the first score, and of making that score a touchdown.
The unexpected information also raises a new business question: if scoring first is so significant, why does the team who wins the coin toss almost always elect to kick first? Is it because the entire NFL grossly misunderstands their own statistics? (Don't be so quick to scoff that possibility -- go read Moneyball.)
Or is it because the situation is too complex to be explained by a single statistic? That's more likely the answer, and the subject of my next BI-related blog.
* Sure, you might consider a year a bit more than "a while," but...
** Despite the Minnesota Vikings not being in Super bowl 52, as they should have been. Sorry, Tim VandeSteeg, it was a good try!
*** Yes, I said, "football." You know, a game characterized by an oblong goal, very large men, and not being rugby. The round-ball game played with no hands is called "soccer," Europe.
**** Okay, BI isn't really that exciting. We work hard, but we rarely literally spring into action, and we don't have theme music.